最近有很多网友咨询小编Excel的相关问题,特别是如何插入图标。小编今天就来详细讲一讲这款软件插入图标的操作方法。
Excel插入图表教程
1、首先,点击电脑左下角的开始—所有程序—office文件包,找到office文件包里的Excel 2007并选择,如下图:
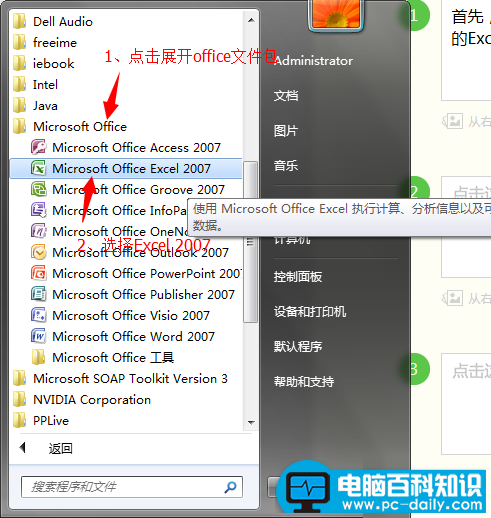
2、点击进入Excel表格的首页如下图所示:
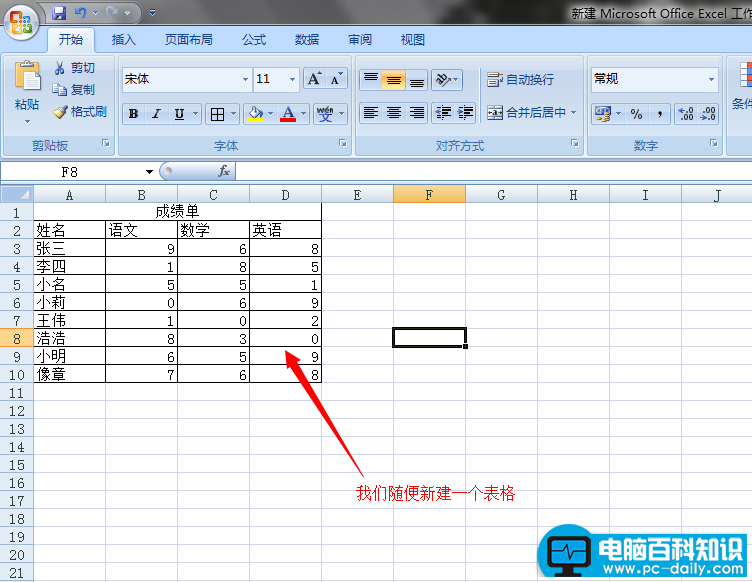
3、在Excel表格首页上随便新建一个表格,输入一下数字,下图中的数字我用的是随机数,如下图:
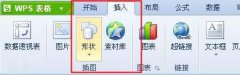
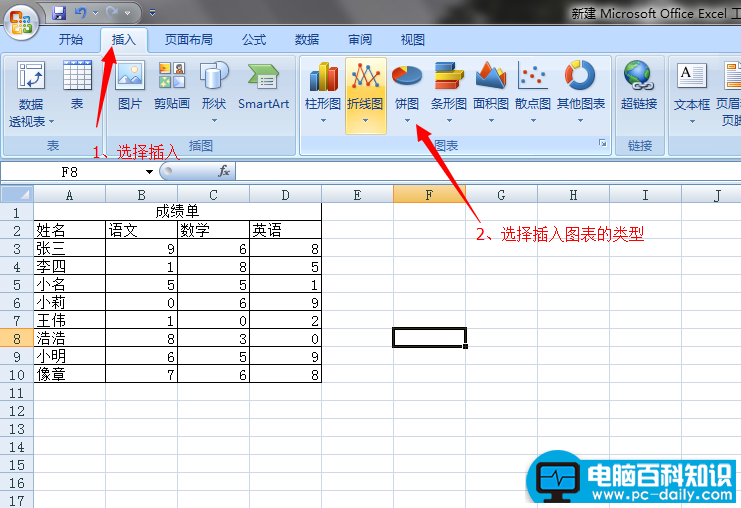
4、找到Excel表格首页菜单栏上的“插入”,点击“插入”,在插入的子菜单下面有图表选项,选择自己想要插入的图表类型,这里我们以“饼图“为例,如下图:
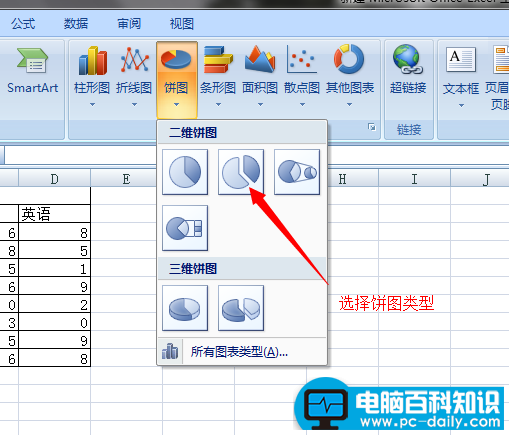
5、点击”饼图“图标后,会弹出一个小窗口,选择”饼图“的类型,这里我们以红标指到的为例,如下图所示:
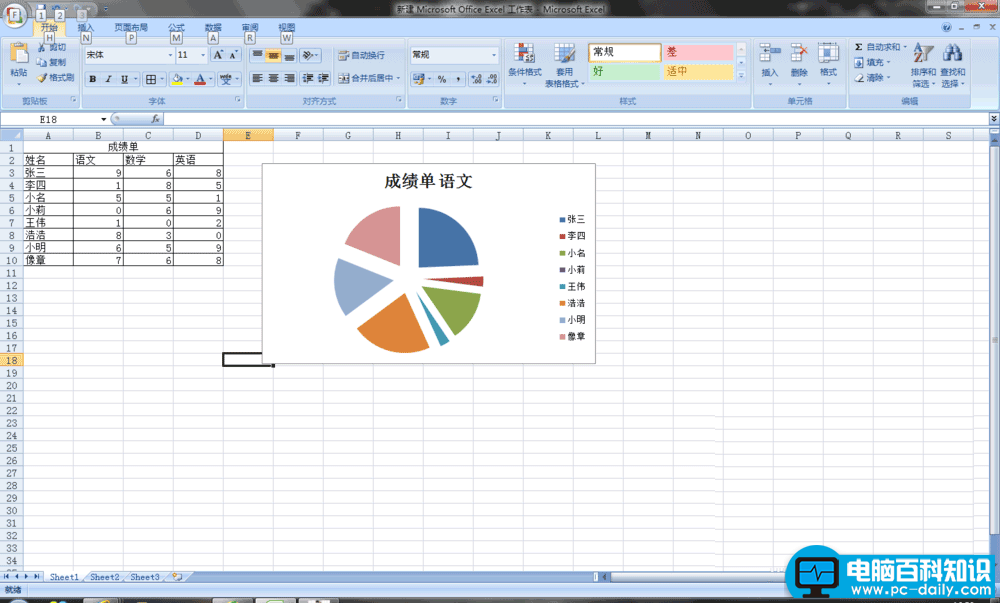
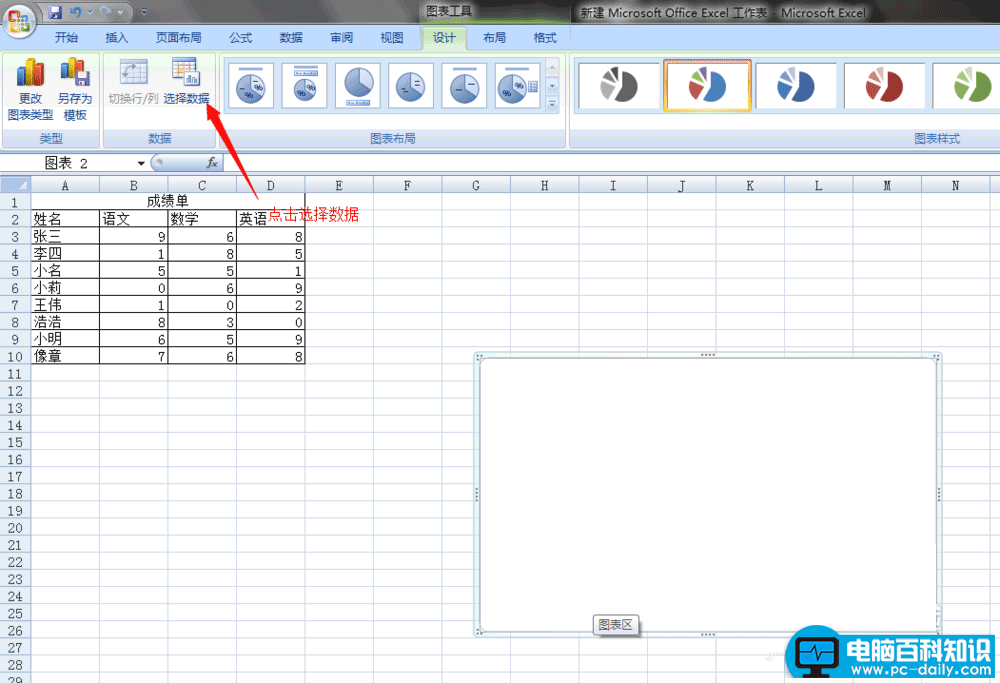
6、点击饼图的类型后,出现如下图,然后点击”选择数据“图标,会弹出一个小窗口,然后选择我们要创建成图表的数据,如下面第二张图所示:
7、在Excel表格里插入图表成功如下图所示: